Главная страница Случайная страница
Разделы сайта
АвтомобилиАстрономияБиологияГеографияДом и садДругие языкиДругоеИнформатикаИсторияКультураЛитератураЛогикаМатематикаМедицинаМеталлургияМеханикаОбразованиеОхрана трудаПедагогикаПолитикаПравоПсихологияРелигияРиторикаСоциологияСпортСтроительствоТехнологияТуризмФизикаФилософияФинансыХимияЧерчениеЭкологияЭкономикаЭлектроника

Purchase $41.95
|
|
Abstract
The present work deals with the compressible flow of nitrogen gas inside microtubes ranging from 30 to 500 μ m and with different values of the surface roughness (< 1%), for different flow regimes. The first part of the work is devoted to a benchmark of friction factor data obtained at DIENCA (University of Bologna) and the ENEA laboratories, using fused silica pipes of 50 and 100 μ m. Data overlapping is excellent thus evidencing how the agreement of the experimental data with the classic theory is independent of the measurement system. The second part of the work demonstrates that classic correlations can predict friction factor in laminar flow without revealing any evident influence of the surface roughness. The laminar-to-turbulent transition starts for Reynolds number not lower than 2000 for smooth pipes, while tending to larger values (3200–4500) for rough pipes. Anyway, contrarily to other available results, no dependence of the critical Reynolds number on the L/D has been observed. Changes in the flow regime have been found of the sharp and smooth type, like for larger pipes; smooth transition looks typical of smooth pipes while the sharp transition in the flow pattern is associated with rough pipes. In the fully developed turbulent regime, obtained for both smooth and rough pipes, an agreement between experimental data and the Blasius correlation has been verified for smooth pipes, while for rough pipes the agreement with predictions given by the Colebrook equation is rather modest.
Keywords
· Microscale;
· Friction factor;
· Gas flow;
· Laminar flow;
· Turbulent flow
Figures and tables from this article:
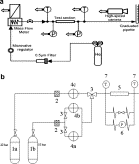
Fig. 1. Sketches of ENEA (a) and DIENCA (1b) facilities.
|
|