Главная страница Случайная страница
Разделы сайта
АвтомобилиАстрономияБиологияГеографияДом и садДругие языкиДругоеИнформатикаИсторияКультураЛитератураЛогикаМатематикаМедицинаМеталлургияМеханикаОбразованиеОхрана трудаПедагогикаПолитикаПравоПсихологияРелигияРиторикаСоциологияСпортСтроительствоТехнологияТуризмФизикаФилософияФинансыХимияЧерчениеЭкологияЭкономикаЭлектроника
Levels of Measurement
|
|
Nominal Measure Example: Gender

|
Female
Male
Ordinal Measure Example: Religiosity " How important is religion to you? "

|
Interval Measure Example: IQ

|
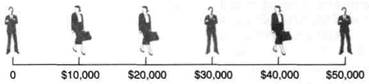
Ratio Measure Example: Income
|
Ratio measures are the highest level, descending through interval and ordinal to nominal, the lowest level of measurement. A variable representing a higher level of measurement—say, ratio—can also be treated as representing a lower level of measurement—say, ordinal. Recall, for example, that age is a ratio measure. If you wished to examine only the relationship between age and some ordinal-level variable—say, self-perceived religiosity: high, medium, and low—you might choose to treat age as
an ordinal-level variable as well. You might characterize the subjects of your study as being young, middle-aged, and old, specifying what age range composed each of these groupings. Finally, age might be used as a nominal-level variable for certain research purposes. People might be grouped as being born during the depression of the 1930s or not. Another nominal measurement, based on birth date rather than just age, would be the grouping of people by astrological signs.
138. Chapter 5: Conceptualization, Operationalization, and Measurement
The level of measurement you'll seek, then, is determined by the analytical uses you've planned for a given variable, keeping in mind that some variables are inherently limited to a certain level. If a variable is to be used in a variety of ways, requiring different levels of measurement, the study should be designed to achieve the highest level required. For example, if the subjects in a study are asked their exact ages, they can later be organized into ordinal or nominal groupings.
You need not necessarily measure variables at their highest level of measurement, however. If you're sure to have no need for ages of people at higher than the ordinal level of measurement, you may simply ask people to indicate their age range, such as 20 to 29, 30 to 39, and so forth. In a study of the wealth of corporations, rather than seek more precise information, you may use Dun & Bradstreet ratings to rank corporations. Whenever your research purposes are not altogether clear, however, seek the highest level of measurement possible. Again, although ratio measures can later be reduced to ordinal ones, you cannot convert an ordinal measure to a ratio one. More generally, you cannot convert a lower-level measure to a higher-level one. That is a one-way street worth remembering.
Typically a research project will tap variables at different levels of measurement. For example, Bielby and Bielby (1999) set out to examine the world of film and television, using a nomothetic, longitudinal approach (take a moment to remind yourself what that means). In what they referred to as the " culture industry, " the authors found that reputation (an ordinal variable) is the best predictor of screenwriters' future productivity. More interestingly, they found that screenwriters who were represented by " core" (or elite) agencies were not only far more likely to find jobs (a nominal variable), but also jobs that paid more (a ratio variable). In other words, Bielby and Bielby found that agencies' reputations (ordinal) was a key independent variable for predicting a screenwriter's career success. The researchers also found that being older (ratio), female (nominal), an ethnic minority (nominal), and having more years of experience (ratio) were disadvantageous for a writer's career. On the other hand, higher earnings from previous years (measured in
ordinal categories) led to more success in the future. In Bielby and Bielby's terms, " success breeds success" (Bielby and Bielby 1999: 80).
Single or Multiple Indicators
With so many alternatives for operationalizing social scientific variables, you may find yourself worrying about making the right choices. To counter this feeling, let me add a momentary dash of certainty and stability.
Many social research variables have fairly obvious, straightforward measures. No matter how you cut it, gender usually turns out to be a matter of male or female: a nominal-level variable that can be measured by a single observation—either by looking (well, not always) or by asking a question (usually). In a study involving the size of families, you'll want to think about adopted and foster children, as well as blended families, but it's usually pretty easy to find out how many children a family has. For most research purposes, the resident population of a country is the resident population of that country—you can look it up in an almanac and know the answer. A great many variables, then, have obvious single indicators. If you can get one piece of information, you have what you need.
Sometimes, however, there is no single indicator that will give you the measure of a variable you really want. As discussed earlier in this chapter, many concepts are subject to varying interpretations—each with several possible indicators. In these cases, you'll want to make several observations for a given variable. You can then combine the several pieces of information you've collected, creating a composite measurement of the variable in question. Chapter 6 is devoted to ways of doing that, so here let's just consider one simple illustration.
Consider the concept " college performance." All of us have noticed that some students perform well in college courses and others don't. In studying these differences, we might ask what characteristics and experiences are related to high levels of performance (many researchers have done just that). How should we measure overall performance? Each grade in any single course is a potential indi-
Operationalization Choices. 139
cator of college performance, but it also may not typify the student's general performance. The solution to this problem is so firmly established that it is, of course, obvious: the grade point average (GPA). We assign numerical scores to each letter grade, total the points earned by a given student, and divide by the number of courses taken to obtain a composite measure. (If the courses vary in number of credits, we adjust the point values accordingly.) It is often appropriate to create such composite measures in social research.
Some Illustrations of Operationalization Choices
To bring together all the operationalization choices available to the social researcher and to show the potential in those possibilities, let's look at some of the distinct ways you might address various research problems. The alternative ways of operationalizing the variables in each case should demonstrate the opportunities that social research can present to our ingenuity and imaginations. To simplify matters, I have not attempted to describe all the research conditions that would make one alternative superior to the others, though in a given situation they would not all be equally appropriate.
Here are specific research questions, then, and some of the ways you could address them. We'll begin with an example discussed earlier in the chapter. It has the added advantage that one of the variables is straightforward to operationalize.
1. Are women more compassionate than men? a. Select a group of subjects for study, with equal numbers of men and women. Present them with hypothetical situations that involve someone's being in trouble. Ask them what they would do if they were confronted with that situation. What would they do, for example, if they came across a small child who was lost and crying for his or her parents? Consider any answer that involves helping or comforting the child as an indicator of compassion. See whether men or women are more likely to indicate they would be compassionate.
b. Set up an experiment in which you pay a small child to pretend that he or she is lost. Put the child to work on a busy sidewalk and observe whether men or women are more likely to offer assistance. Also be sure to count the total number of men and women who walk by, because there may be more of one than the other. If that's the case, simply calculate the percentage of men and the percentage of women who help.
с Select a sample of people and do a survey in which you ask them what organizations they belong to. Calculate whether women or men are more likely to belong to those that seem to reflect compassionate feelings. To take account of men who belong to more organizations than do women in general— or vice versa—do this: For each person you study, calculate the percentage of his or her organizational memberships that reflect compassion. See if men or women have a higher average percentage.
2. Are sociology students or accounting students
better informed about world affairs?
a. Prepare a short quiz on world affairs and
arrange to administer it to the students in a
sociology class and in an accounting class at
a comparable level. If you want to compare
sociology and accounting majors, be sure to
ask students what they are majoring in.
b. Get the instructor of a course in world affairs
to give you the average grades of sociology
and accounting students in the course.
с Take a petition to sociology and accounting classes that urges that " the United Nations headquarters be moved to New York City." Keep a count of how many in each class sign the petition and how many inform you that the UN headquarters is already located in New York City.
3. Do people consider New York or California the
better place to live?
a. Consulting the Statistical Abstract of the United States or a similar publication, check the migration rates into and out of each state. See if you can find the numbers moving
140 • Chapter 5: Conceptualization, Operationalization, and Measurement
directly from New York to California and vice versa.
b. The national polling companies—Gallup, Harris, Roper, and so forth—often ask people what they consider the best state to live in. Look up some recent results in the library or through your local newspaper.
с Compare suicide rates in the two states. 4. Who are the most popular instructors on your
campus, those in the social sciences, the natural
sciences, or the humanities?
a. If your school has a provision for student
evaluation of instructors, review some re
cent results and compute the average rating
of each of the three groups.
b. Begin visiting the introductory courses
given in each group of disciplines and mea
sure the attendance rate of each class.
с In December, select a group of faculty in each of the three divisions and ask them to keep a record of the numbers of holiday greeting cards and presents they receive from admiring students. See who wins.
The point of these examples is not necessarily to suggest respectable research projects but to illustrate the many ways variables can be operationalized.
|
|