Главная страница Случайная страница
Разделы сайта
АвтомобилиАстрономияБиологияГеографияДом и садДругие языкиДругоеИнформатикаИсторияКультураЛитератураЛогикаМатематикаМедицинаМеталлургияМеханикаОбразованиеОхрана трудаПедагогикаПолитикаПравоПсихологияРелигияРиторикаСоциологияСпортСтроительствоТехнологияТуризмФизикаФилософияФинансыХимияЧерчениеЭкологияЭкономикаЭлектроника
A new counterbalance
|
|
However, one finding from the group muddies this seemingly linear relationship. Manizza found a discrepancy between 2005 and 2007, the most severe periods of sea ice shrinkage. While the Arctic lost more ice cover in 2007 than in 2005, less carbon was taken up by the ocean in 2007 — an unexpected finding, in light of the theory that less sea ice leads to more carbon stored.
Manizza traced the discrepancy to the Greenland and Barents seas, regions of the Arctic Ocean that take in warmer waters from the Atlantic. (In warmer environments, carbon is less soluble in seawater.) Manizza observed this scenario in the Barents Sea in 2007, when warmer temperatures caused more carbon dioxide to be released than stored.
The results point to a subtle balance: An ocean’s carbon flow depends on both water temperature and biological activity. In warmer waters, carbon is more likely to be expelled into the atmosphere; in waters with more biological growth — for example, due to less sea ice — carbon is more likely to be stored in ocean organisms.
In short, while the Arctic Ocean as a whole seems to be storing more carbon than in previous years, the increase in the carbon sink may not be as large as scientists had previously thought.
“The Arctic is special in that it’s certainly a place where we see changes happening faster than anywhere else, ” Dutkiewicz says. “Because of that, there are bigger changes in the sea ice and biology, and therefore possibly to the carbon sink.”
Manizza adds that while the remoteness of the Arctic makes it difficult for scientists to obtain accurate measurements, more data from this region “can both inform us about the change in the polar area and make our models highly reliable for policymaking decisions.”
This research was supported by the National Science Foundation and the National Oceanic and Atmospheric Administration.
Текст 3

acquired 1979 - 2012
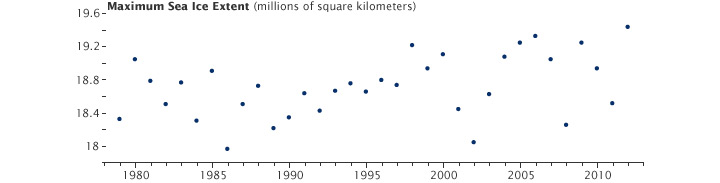
Two weeks after a new record was set in the Arctic Ocean for the least amount of sea ice coverage in the satellite record, the ice surrounding Antarctica reached its annual winter maximum—and set a record for a new high. Sea ice extended over 19.44 million square kilometers (7.51 million square miles) in 2012, according to the National Snow and Ice Data Center (NSIDC). The previous record of 19.39 million kilometers (7.49 million square miles) was set in 2006.
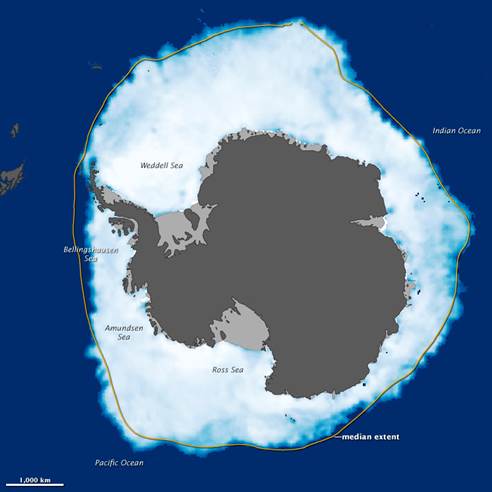
The map above shows sea ice extent around Antarctica on September 26, 2012, when ice covered more of the Southern Ocean than at any other time in the satellite record. The map is based on an NSIDC analysis of data from the Special Sensor Microwave/Imagers flown in the Defense Meteorological Satellite Program. Land is dark gray, and ice shelves—which are attached to land-based glaciers but floating on the ocean—are light gray. The yellow outline shows the median sea ice extent in September from 1979 to 2000. Sea ice extent is defined as the total area in which the ice concentration is at least 15 percent.
The graph of NSIDC data shows the maximum extent for each September since 1979 in millions of square kilometers. There is a lot of variability from year to year, though the overall trend shows growth of about 0.9 percent per decade.
According to a recent study by sea ice scientists Claire Parkinson and Donald Cavalieri of NASA’s Goddard Space Flight Center, Antarctic sea ice increased by roughly 17, 100 square kilometers per year from 1979 to 2010. Much of the increase, they note, occurred in the Ross Sea, with smaller increases in Weddell Sea and Indian Ocean. At the same time, the Bellinghausen and Amundsen Seas have lost ice. “The strong pattern of decreasing ice coverage in the Bellingshausen/Amundsen Seas region and increasing ice coverage in the Ross Sea region is suggestive of changes in atmospheric circulation, ” they noted.
“The year 2012 continues a long-term contrast between the two hemispheres, with decreasing sea ice coverage in the Arctic and increasing sea ice coverage in the Antarctic, ” Parkinson added. “Both hemispheres have considerable inter-annual variability, so that in either hemisphere, next year could have either more or less sea ice than this year. Still, the long-term trends are clear, but not equal: the magnitude of the ice losses in the Arctic considerably exceed the magnitude of the ice gains in the Antarctic.”
On their Arctic Sea Ice News and Analysis blog, scientists from the University of Colorado wrote: “Comparing winter and summer sea ice trends for the two poles is problematic since different processes are in effect. During summer, surface melt and ice-albedo feedbacks are in effect; winter processes include snowfall on the sea ice, and wind. Small changes in winter extent may be a more mixed signal than the loss of summer sea ice extent. An expansion of winter Antarctic ice could be due to cooling, winds, or snowfall, whereas Arctic summer sea ice decline is more closely linked to decadal climate warming.”
acquired September 17, 2014

Arctic sea ice continued its long-term decline in 2014, as the ice reached its annual minimum extent on September 17. According to the National Snow and Ice Data Center (NSIDC), Arctic sea ice covered just 5.02 million square kilometers (1.94 million square miles) this summer, an extent similar to 2013 and well below the 1981–2010 average of 6.22 million square kilometers (2.40 million square miles). The 2014 sea ice extent was the sixth lowest recorded in the modern satellite era.
The summer started off as a relatively cool one, and lacked the big storms or persistent winds that can break up ice and increase melting, said Walter Meier, a research scientist at NASA's Goddard Space Flight Center. “Even with a relatively cool year, the ice is so much thinner than it used to be, ” Meier said. “It's more susceptible to melting.”
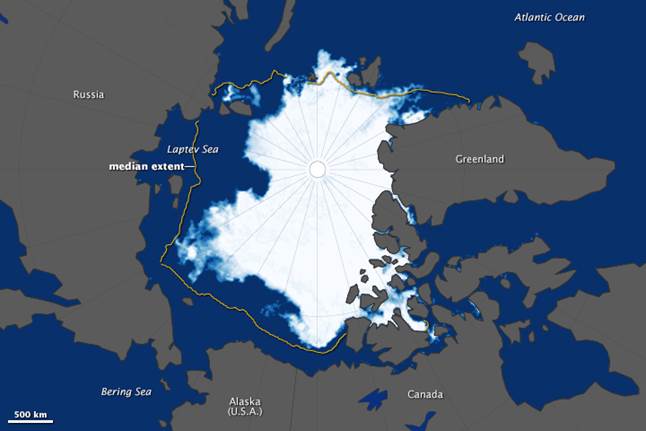
The Northwest Passage remained ice-bound this summer. But a patch of open water stretched far north of Siberia in the Laptev Sea, reaching 85 degrees north. It is the farthest north that scientists have observed open ocean water in the satellite era, Meier said.
While summer sea ice has covered more of the Arctic in the past two years than in the record low of 2012, it does not mean the Arctic is returning to average conditions. This year's minimum extent fits with a long downward trend in which the Arctic Ocean has lost about 13 percent of its sea ice per decade since the late 1970s.
To measure sea ice extent, scientists include areas that are at least 15 percent ice-covered. The NASA-developed computer program, which is one of several methods scientists use to calculate extent, is based on data from sensors on the NASA's Nimbus 7 satellite, which operated from 1978 to 1987, and the U.S. Department of Defense's Defense Meteorological Satellite Program, which has provided information since 1987.
The map above shows the extent of arctic sea ice on September 17, 2014. The map is based on data from the Advanced Microwave Scanning Radiometer 2 (AMSR2) sensor on Japan's Global Change Observation Mission 1st-Water (GCOM-W1) satellite. The yellow outline on the map shows the median sea ice extent observed in September from 1981 through 2010.
Meanwhile, sea ice on the other side of the planet was headed in the opposite direction. The second map, also based on data from the AMSR2 sensor, shows Antarctic sea ice on September 19, 2014. While it was not yet possible to determine if the ice had reached its maximum extent for the year, the five-day average had already surpassed 20 million square kilometers (7.70 million square miles) for the first time in the modern satellite record, according to NSIDC.

acquired September 19, 2014
“This is not unexpected, ” said Nathan Kurtz, a cryospheric scientist at NASA Goddard. He noted that many climate models actually predict a short-term increase in Antarctic sea ice. Factors like increasing fresh water and higher wind speeds promote ice growth and expansion—factors that appear to be dominating right now. In the long-term, Kurtz added, “increasing near-surface air temperatures are expected to have the stronger effect and begin to melt the ice and halt the expansion.”
Sea ice around Antarctica has been increasing, but not by much. “The overall trend of sea ice expansion in the Antarctic is only one-third of the magnitude of the decrease in arctic sea ice, ” Kurtz said.
Antarctic sea ice develops and evolves under vastly different circumstances than Arctic sea ice. In the north, sea ice sits in a nearly land-locked ocean, while sea ice in the southern hemisphere exists in the open ocean surrounding an extensive land mass. This geography affects how the ice expands and retreats in response to climate, leading in part to the differing sea ice scenarios at the two poles.
Текст 4
|
|